
Product & Platform October 2, 2026

4L Insights design system

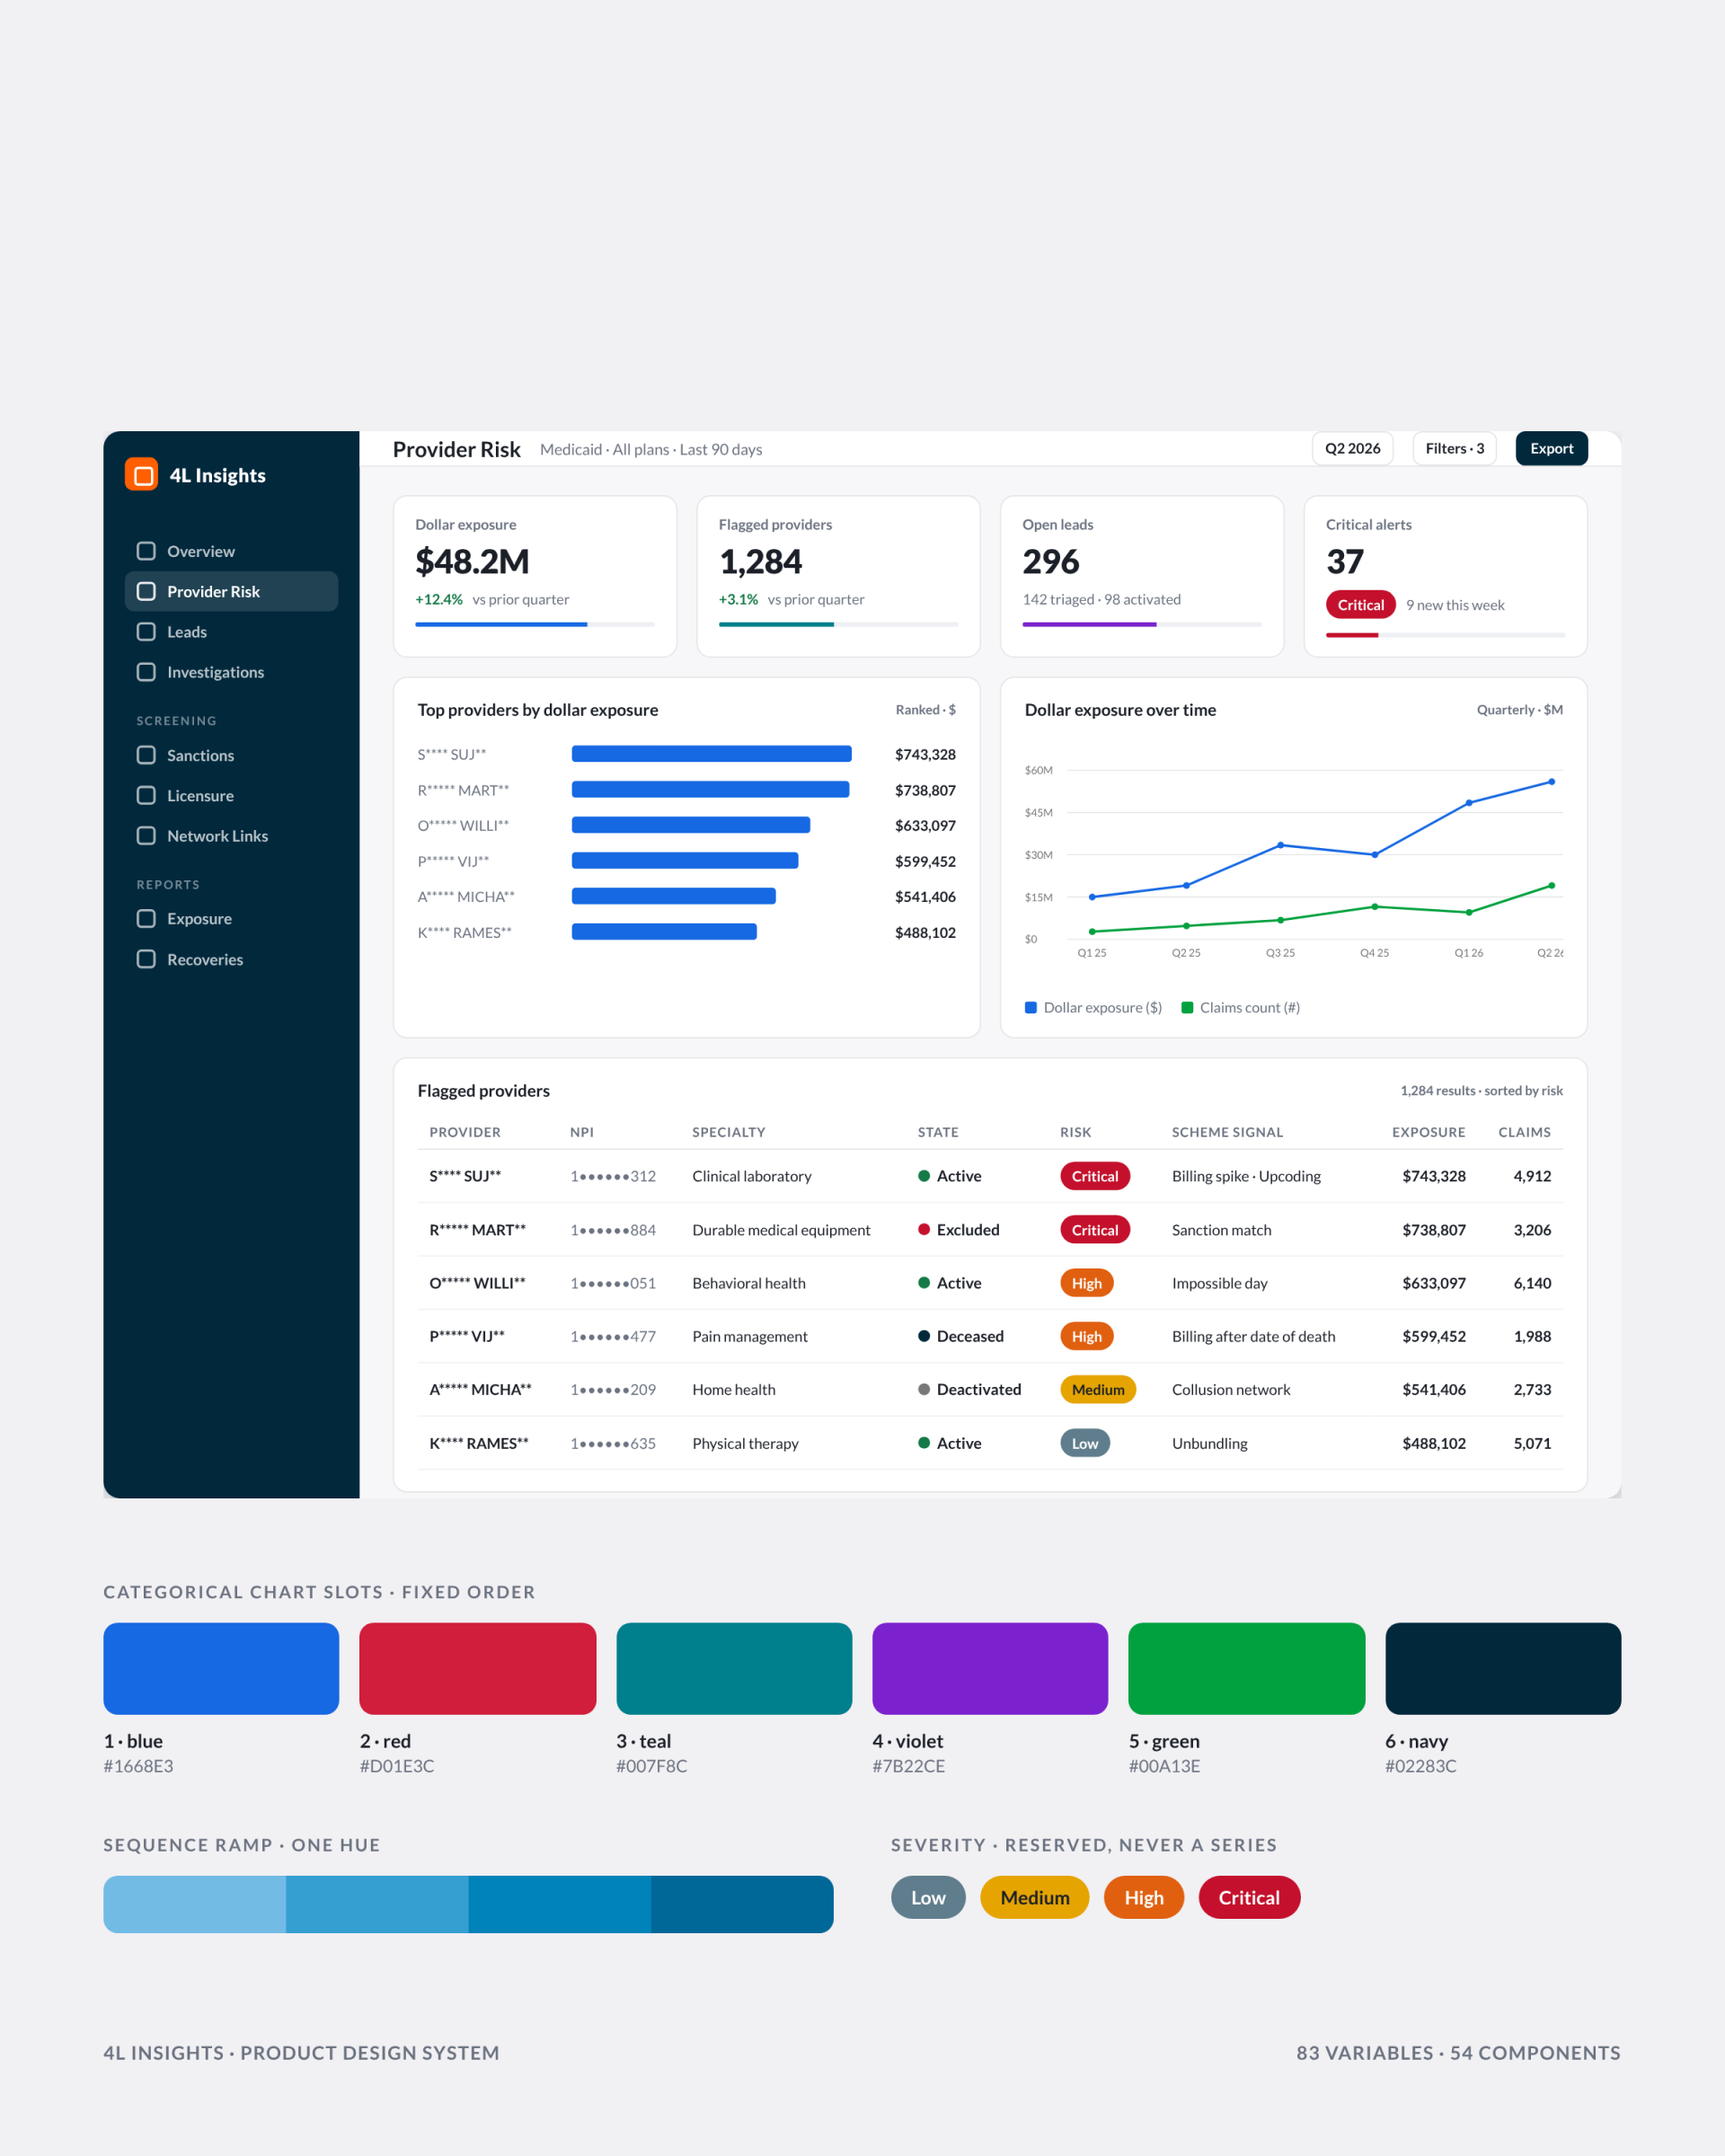
4L Data is a healthcare AI company whose SaaS platform, 4L Insights, screens providers and claims for fraud before payment. I rebuilt the platform’s design system: 83 variables, 54 components and the rules behind them, after walking all eleven live modules and finding no spacing scale and three different ideas of what a chart color meant.

Task

Give a data-dense fraud platform one set of tokens and components, so a developer can build a screen without asking what any value means.
  • Strategy

    Design Systems, Product Design

  • Design

    Tokens, Components, Data Viz

  • Client

    4L Data

A product design system for a healthcare AI company’s fraud platform: 83 variables, 54 components and the rules that made eleven modules read as one product.

Client: 4L Data, a healthcare AI company. Product: 4L Insights, a SaaS platform for fraud detection and provider intelligence, eleven live modules.

My role: Product design lead. I ran the audit, built the tokens and components in Figma, wrote the display rules and handed the system to two engineering teams through Dev Mode.

Results: 83 variables, 54 components, 219 variants, every value a variable. Six display rules now settle questions that used to be decided screen by screen.

Audit

What eleven modules had in common

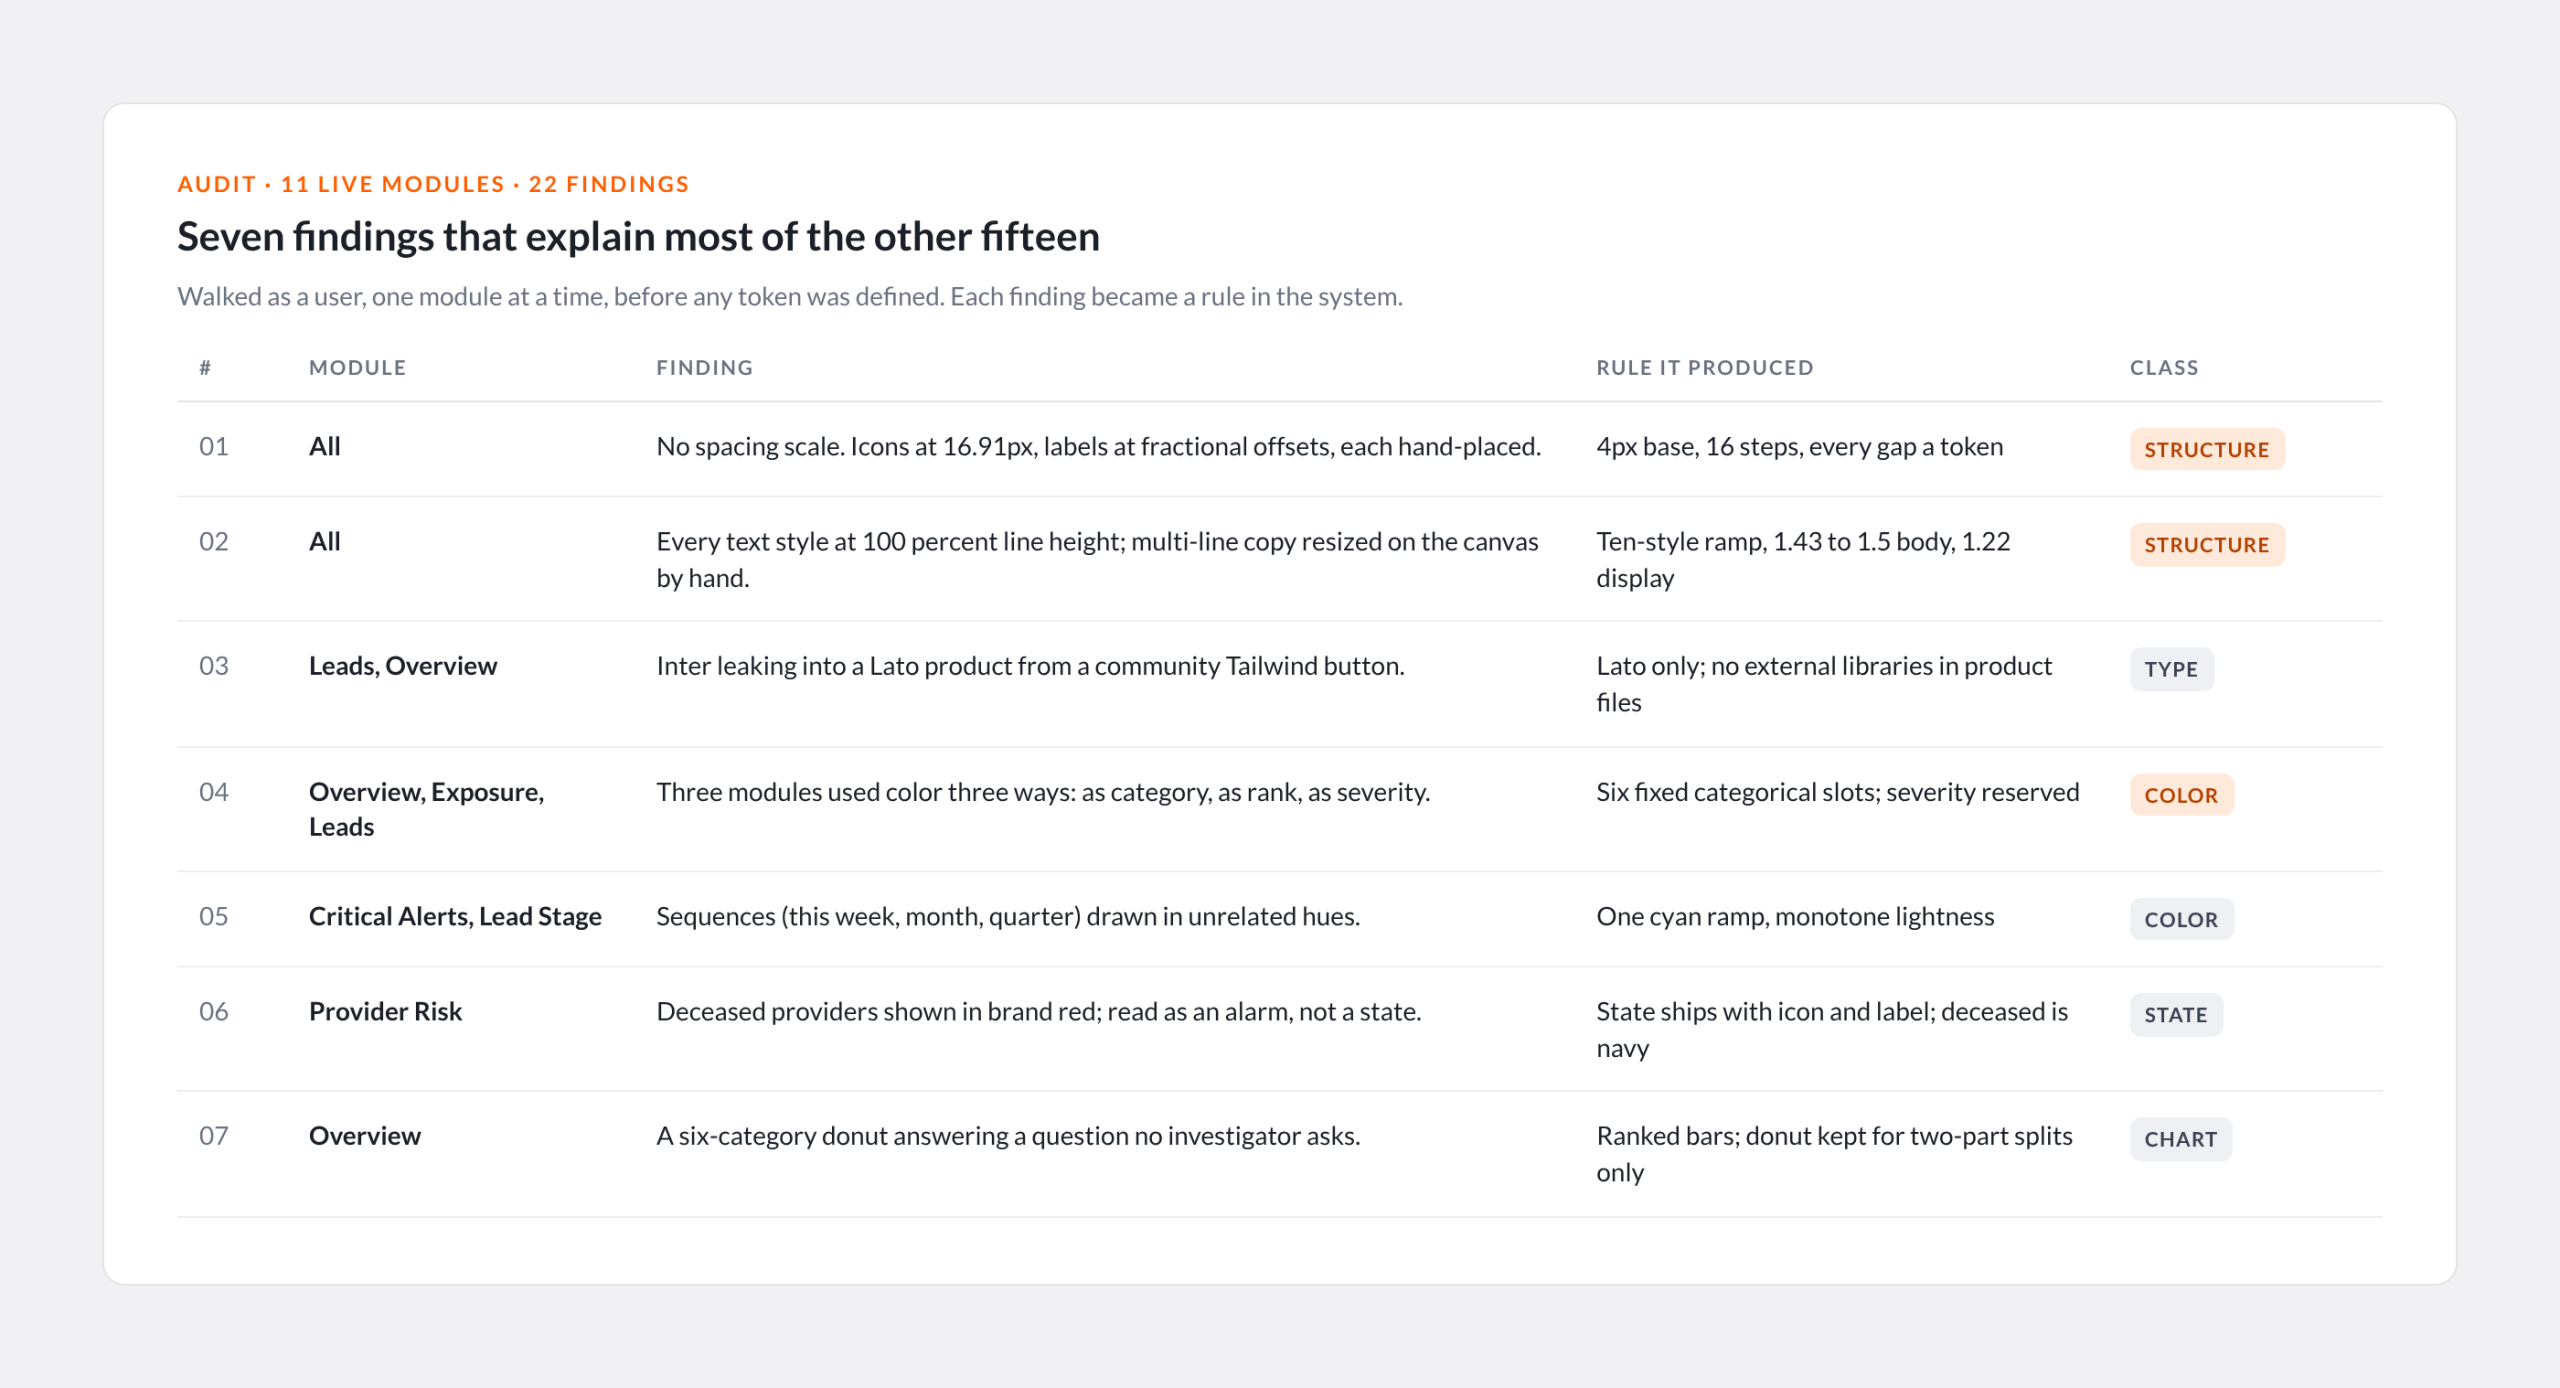
4L Insights had grown one module at a time, with two engineering teams building from screenshots of each other’s work. Before defining anything I walked all eleven modules as a user and logged 22 findings. Three explain most of the rest: no spacing scale, so every offset was hand-placed; every text style at 100 percent line height; and chart color meaning three different things in three modules. An investigator moving between screens had to relearn the palette each time.

Seven of the 22 findings, each with the rule it produced. The audit came before any token was defined.
By the numbers

The system

0
Variables

Brand, text, surface, chart and state. One change moves everywhere.

0
Components

219 variants across tables, cards, charts, inputs and navigation.

0
Live modules audited

Walked as a user before any token existed.

0
Recorded findings

Each one became a rule in the system.

First decision

Carry the brand through unmodified, then stop

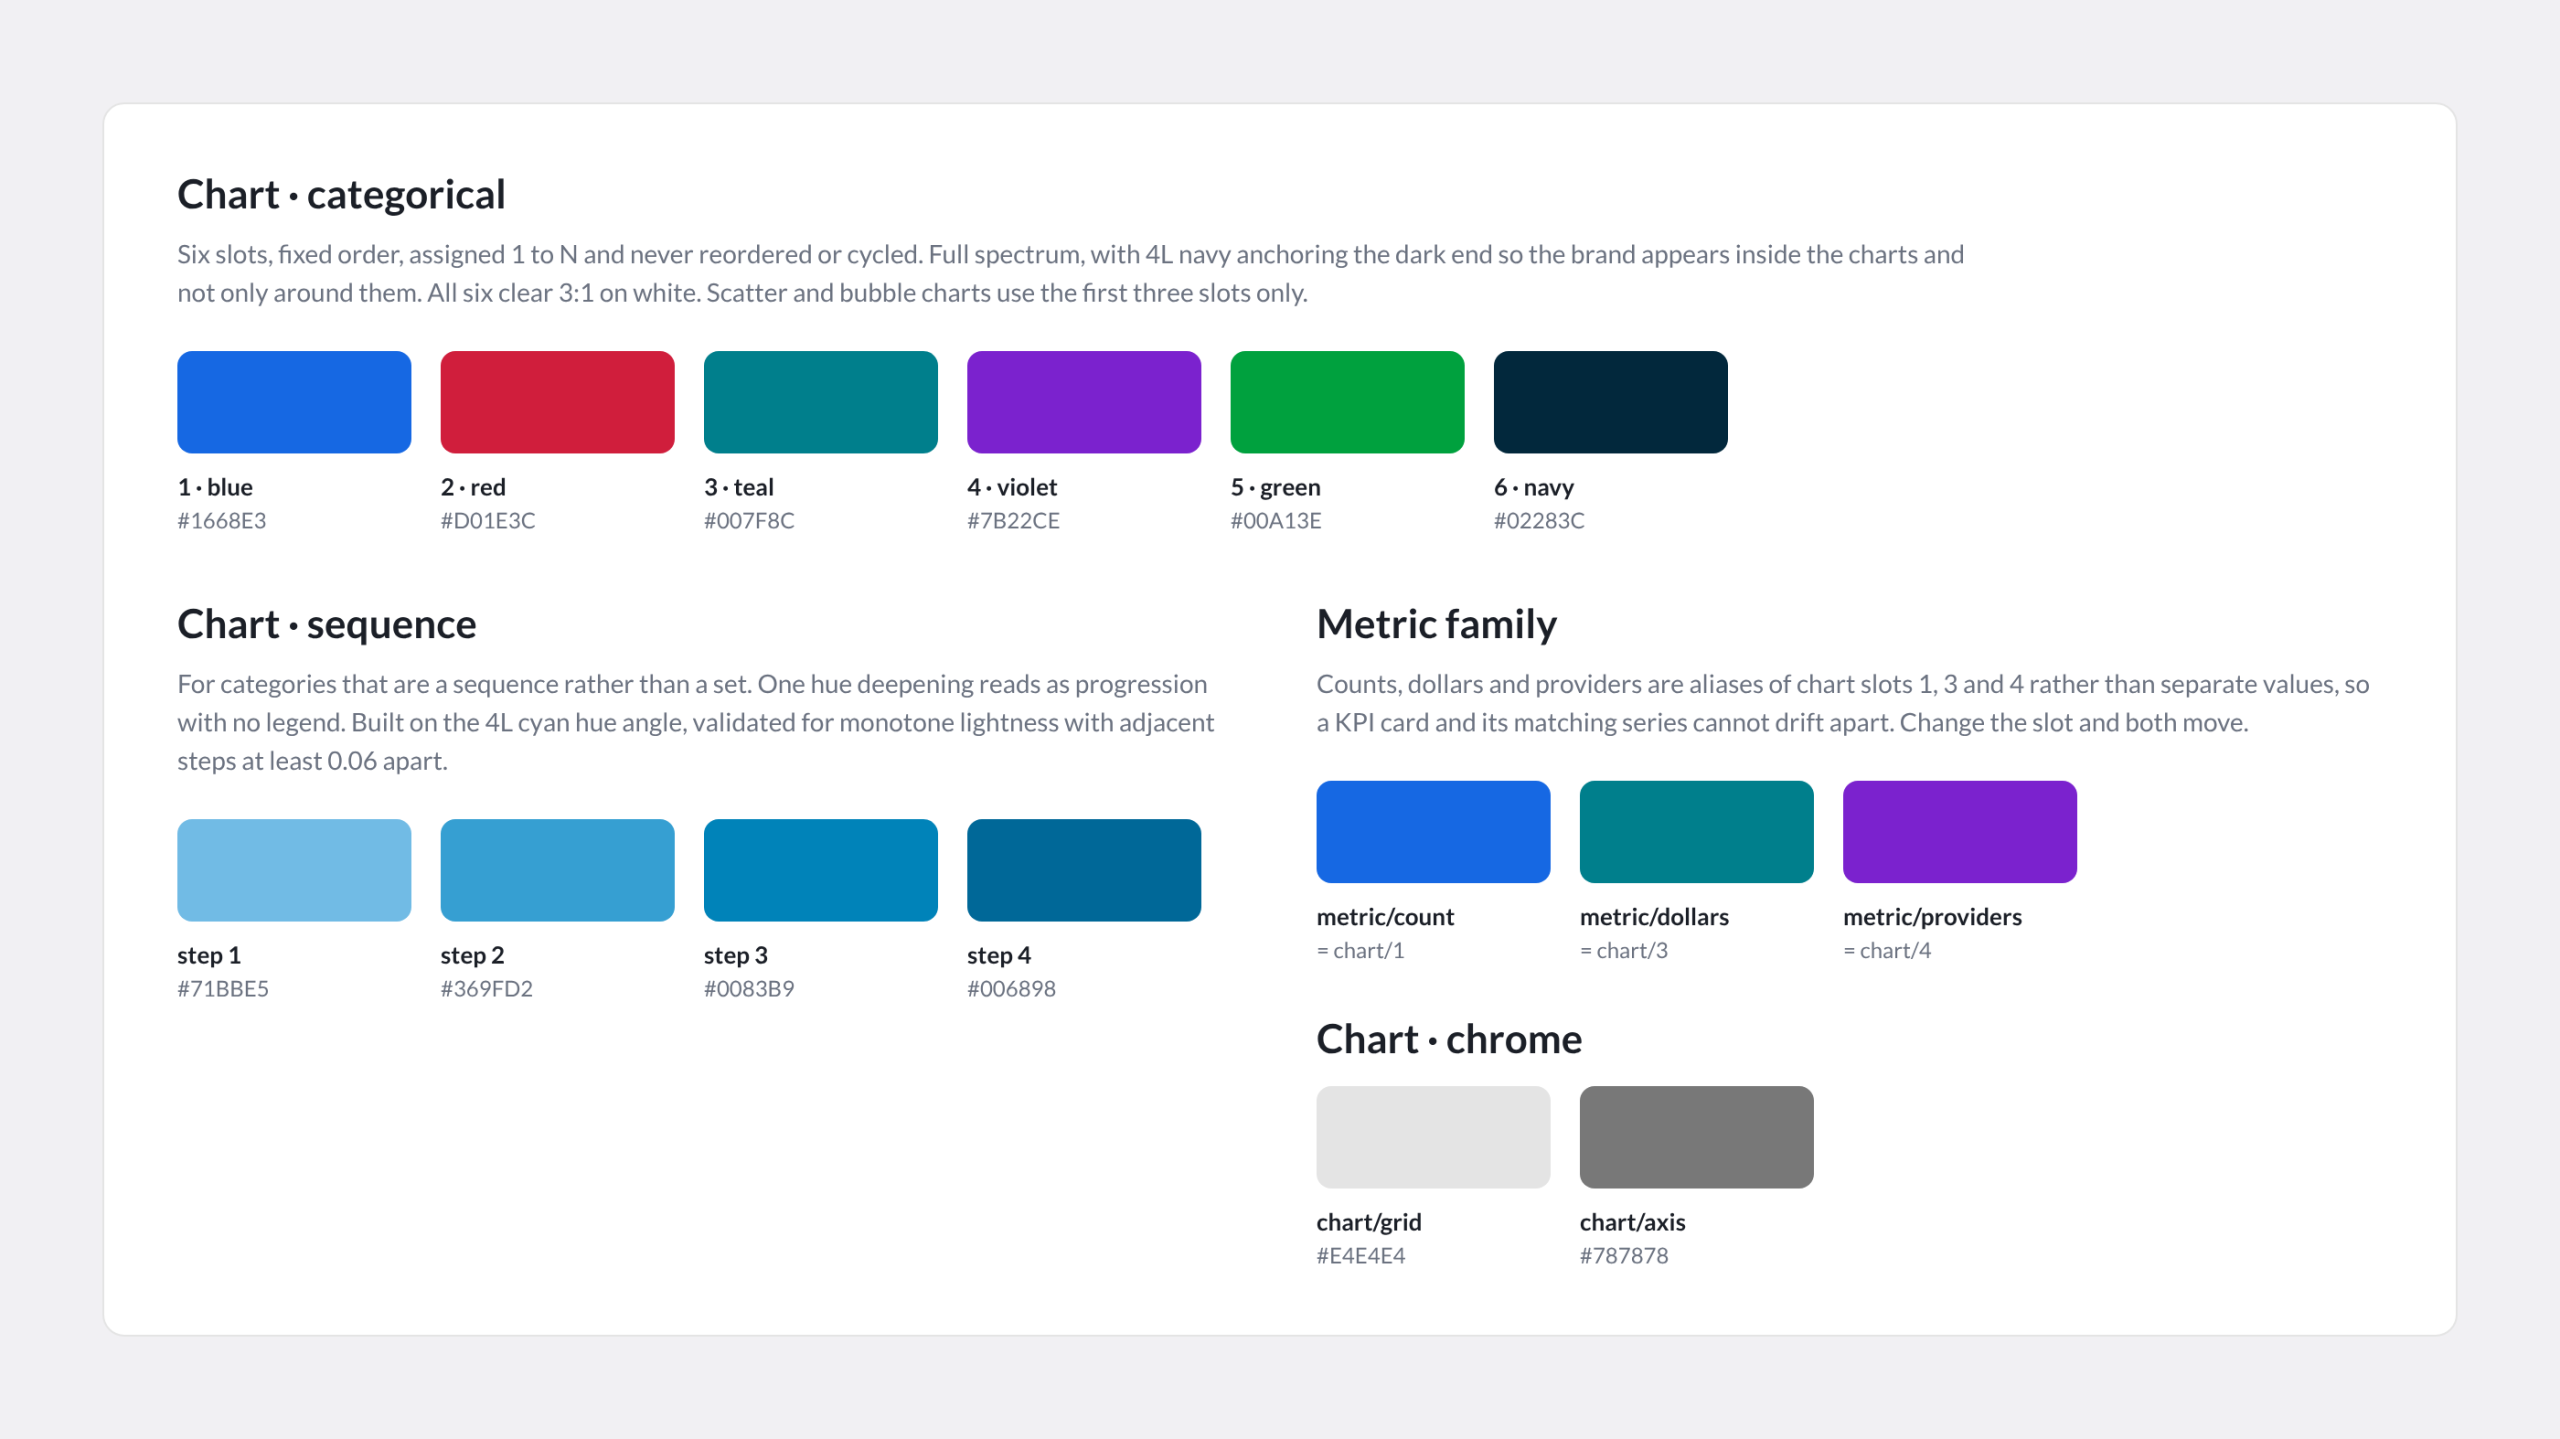
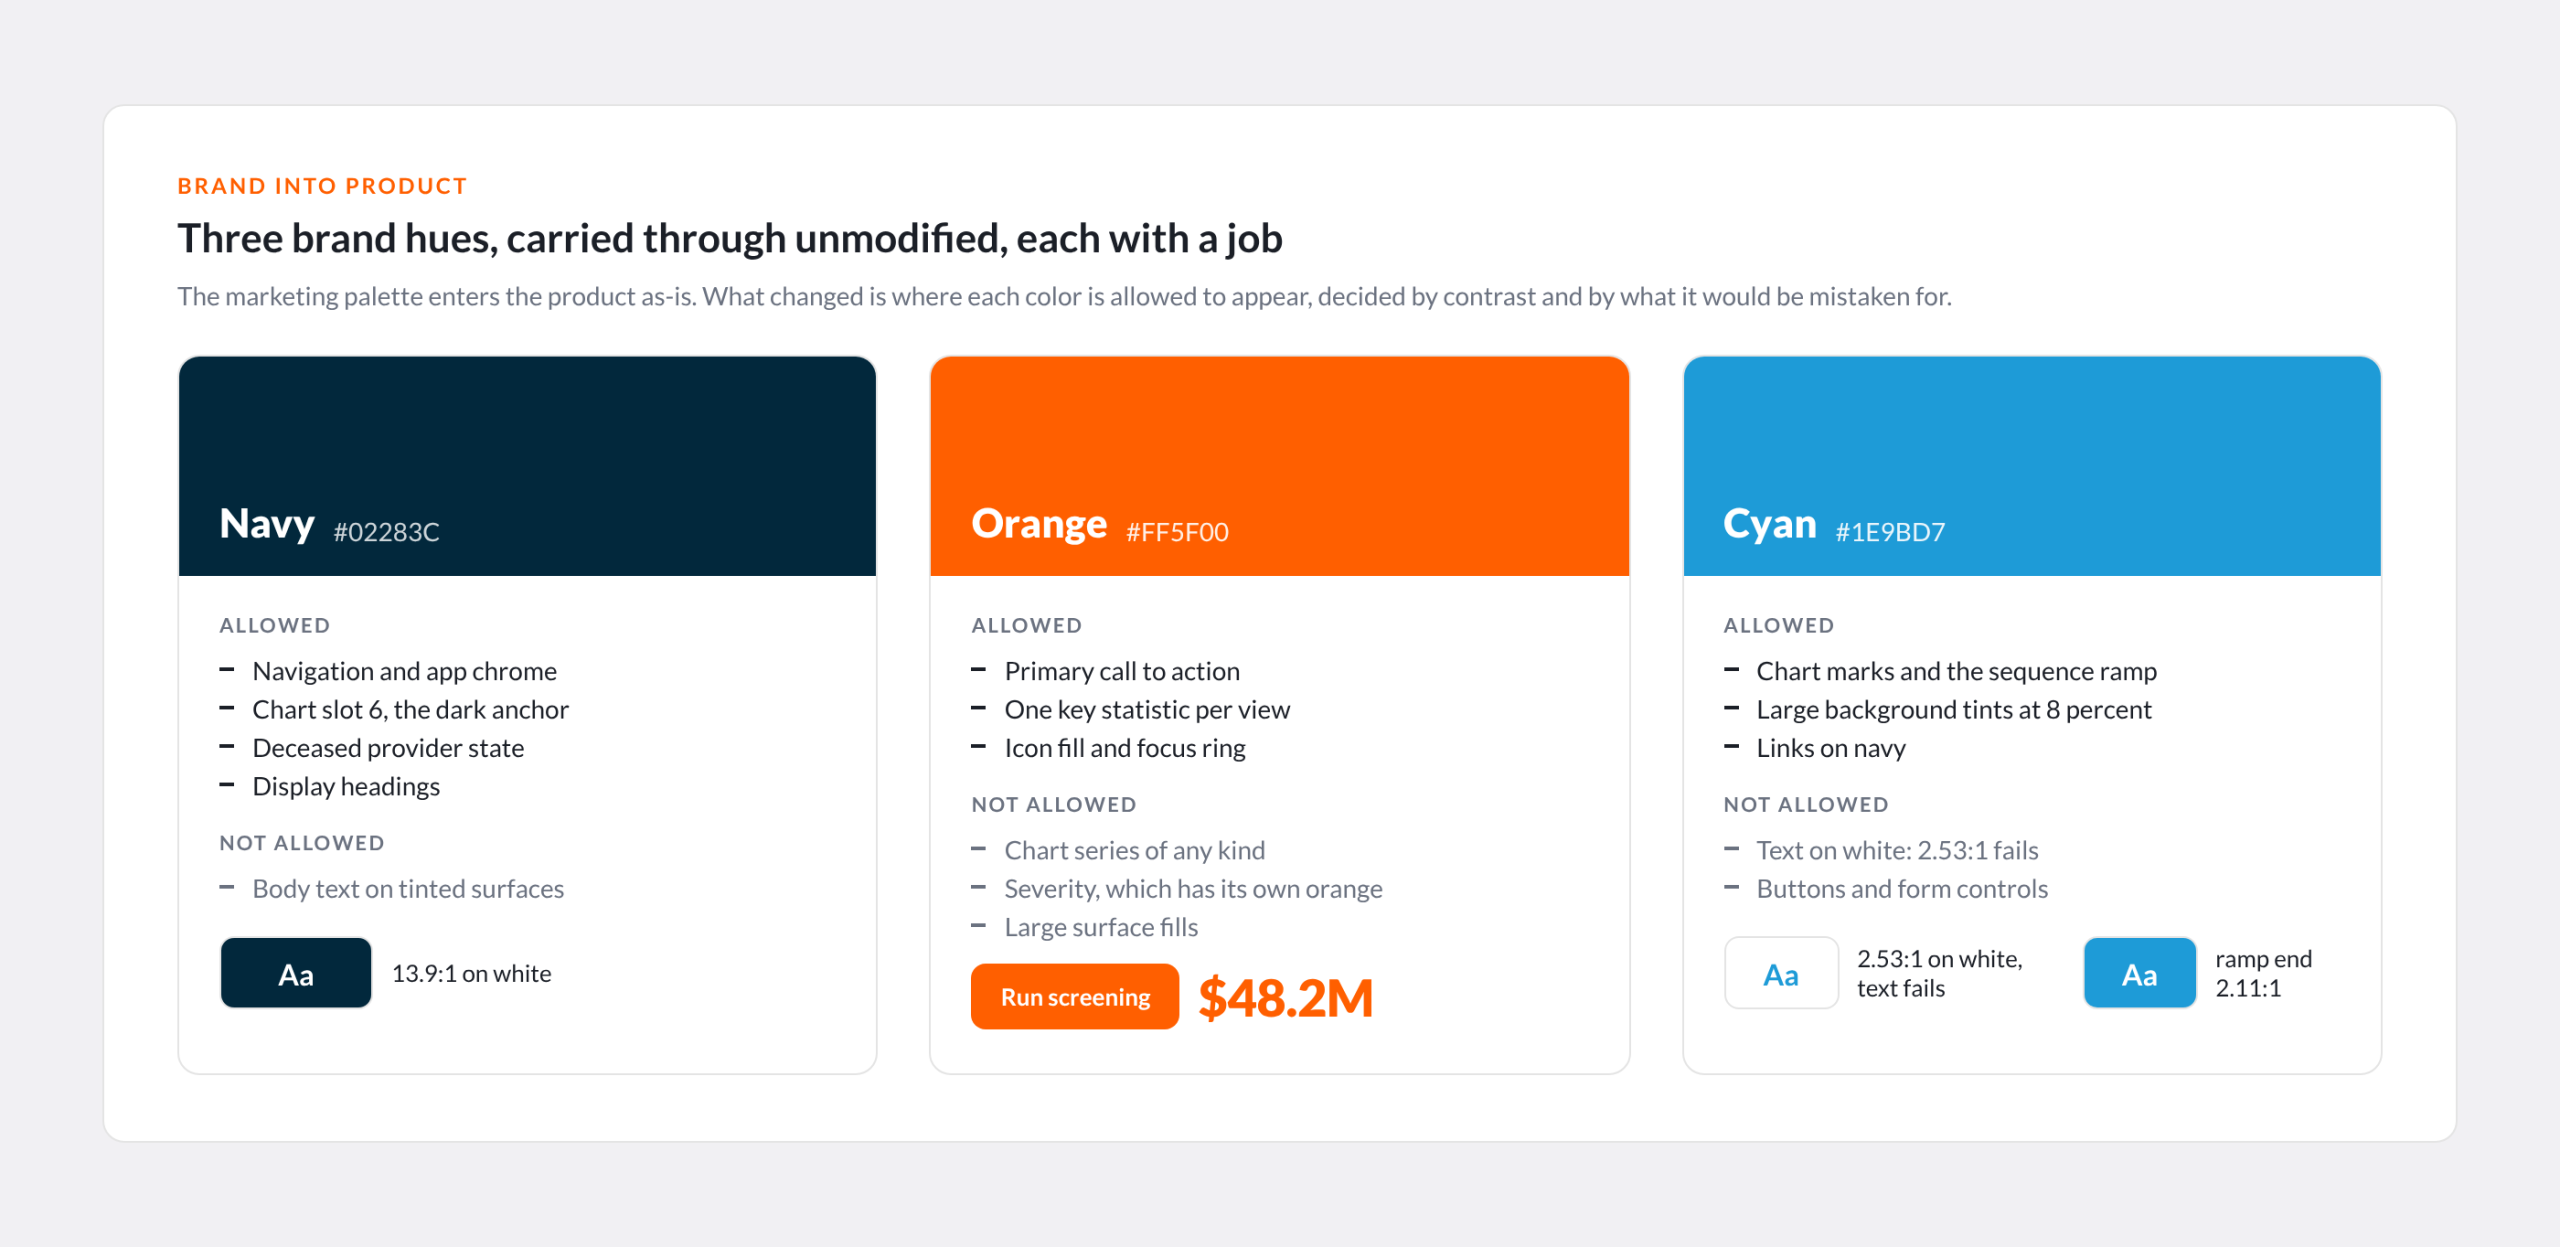
The marketing palette is three hues, navy, orange and cyan, and all three enter the product unaltered. What I drew was the line around each. Orange is action only: one call to action, one key statistic, an icon fill, never a surface and never a series. Cyan fails text contrast on white at 2.53:1, so it lives on navy, as the hue angle of the sequence ramp and as an 8 percent tint. Navy is the only color allowed as a large fill.

The rejected option was a separate product palette. It would have looked more polished in Figma and less like the company’s product in a sales demo.

Three brand hues enter the product unaltered. The work was deciding where each is allowed to appear, by contrast and by what it would be mistaken for.
Display rules

What a color is allowed to mean

Categorical charts get six fixed slots, assigned in order and never cycled, with navy anchoring the dark end so the brand shows up inside the charts.

Sequences get one hue. This week, this month and this quarter had been three unrelated colors. One cyan ramp reads as progression with no legend.

A KPI and its chart cannot drift apart. Counts, dollars and providers are aliases of chart slots, so the card and the series move together.

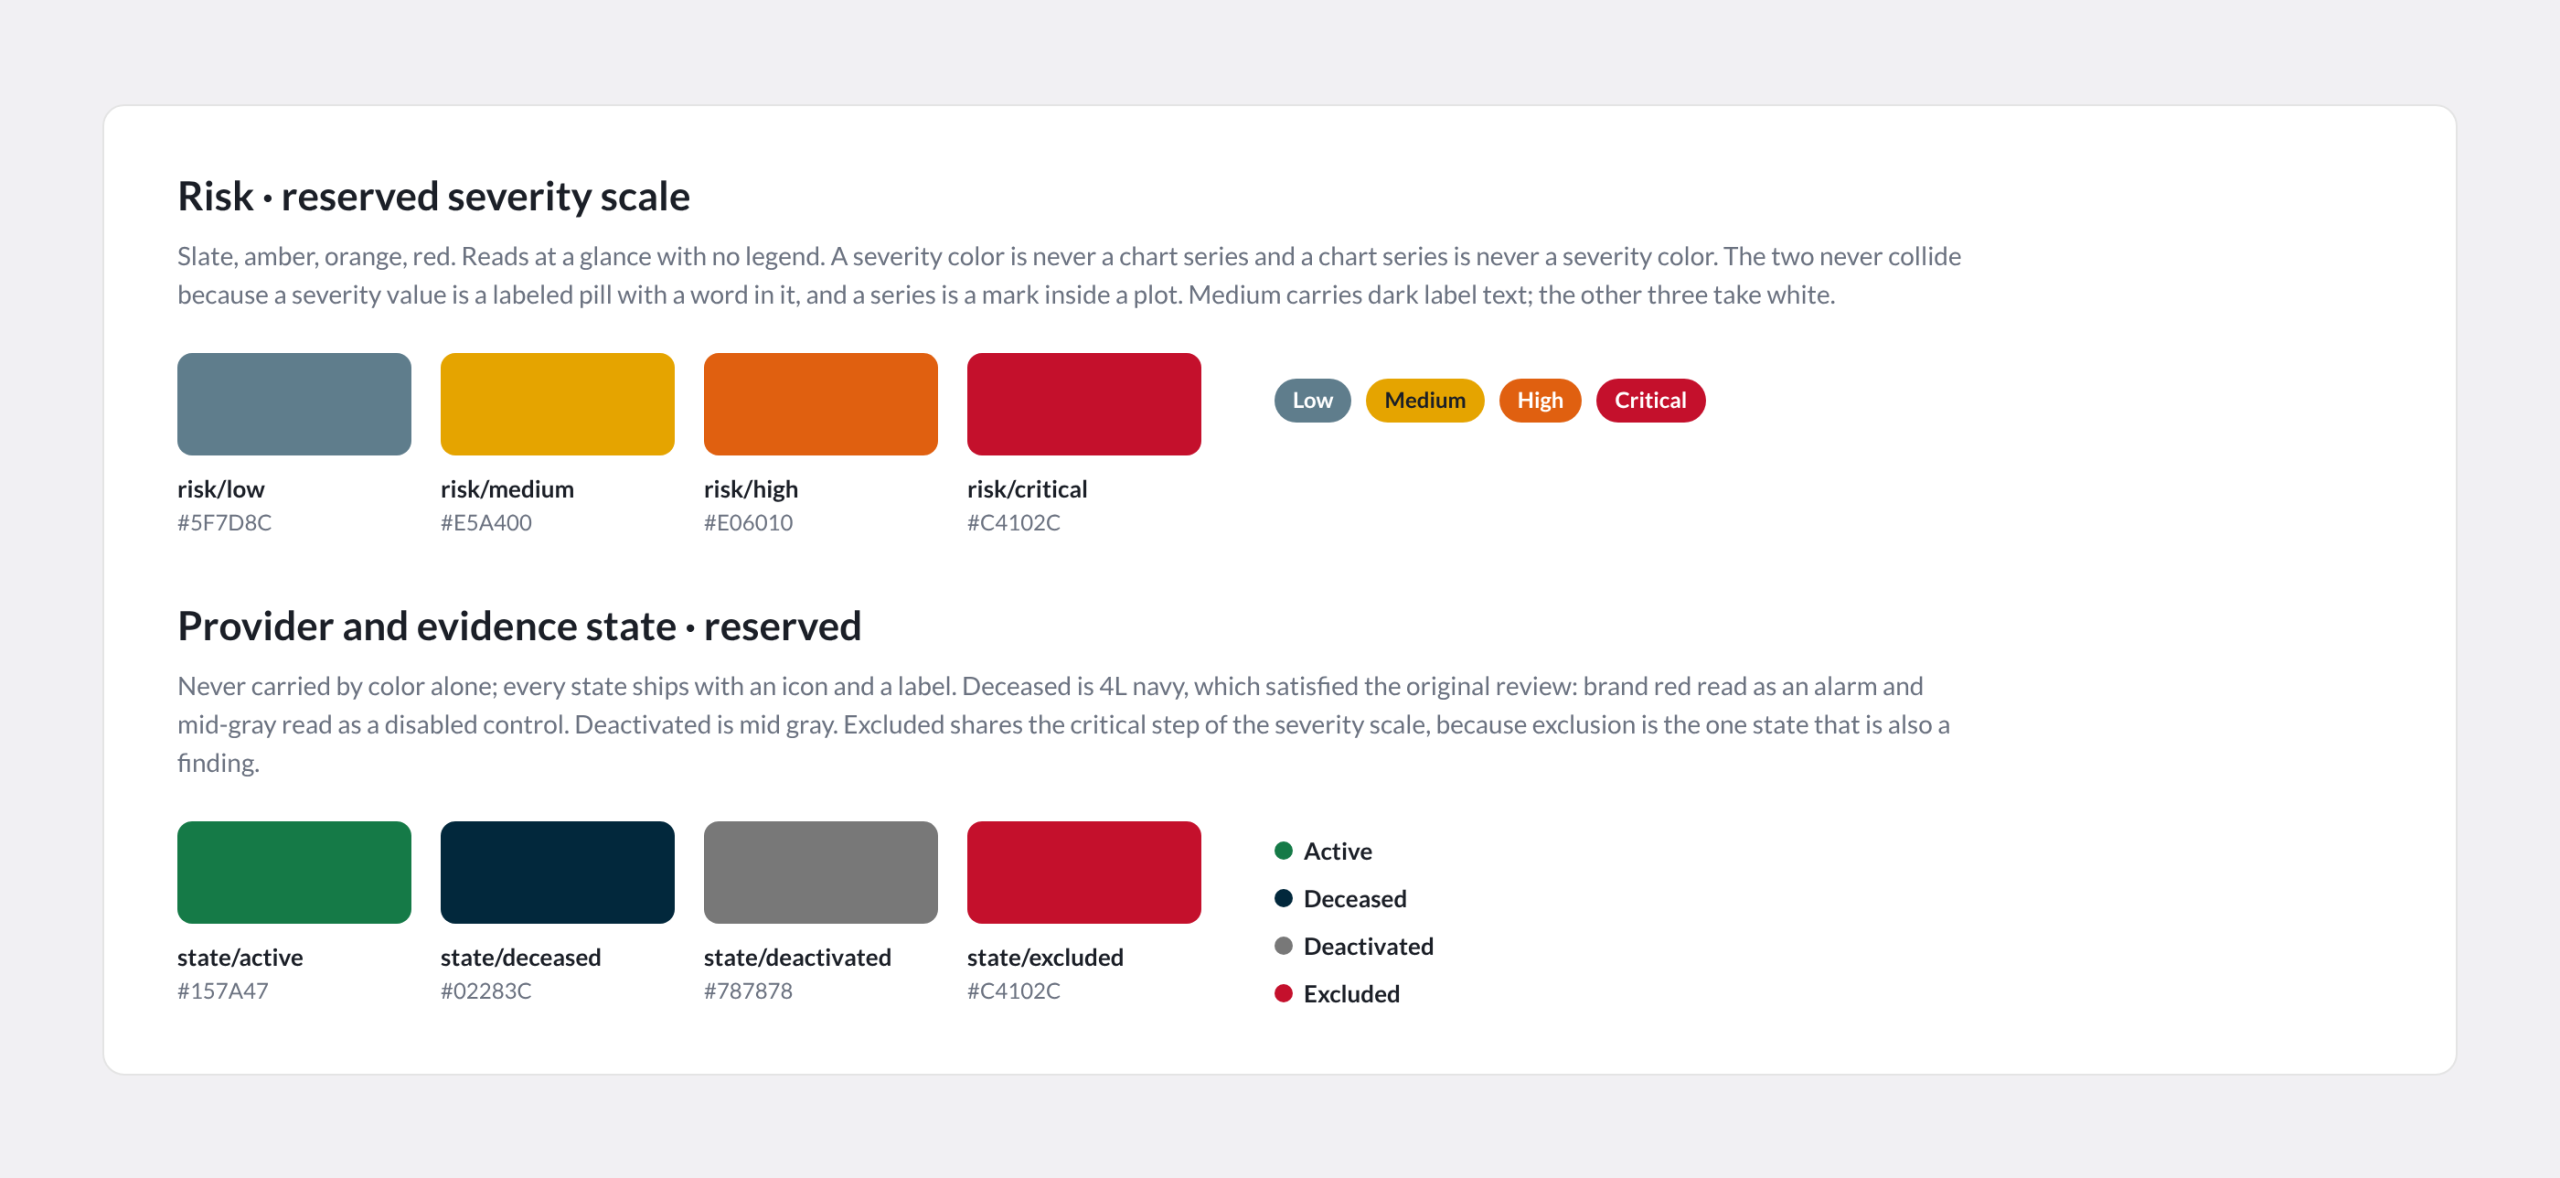
Severity is reserved. Slate, amber, orange and red mean risk and nothing else. A severity value is a labeled pill; a series is a mark in a plot. They never collide.

State is never color alone. Active, deceased, deactivated and excluded ship with an icon and a label. Deceased is navy: brand red read as an alarm and gray read as disabled.

Six categorical slots, one sequence ramp, and the metric family defined as aliases so a KPI card and its chart cannot drift apart.
Severity and provider state are reserved scales. Neither is ever a chart series, and state never ships as color alone.
Type and space

A 4px base and a type ramp

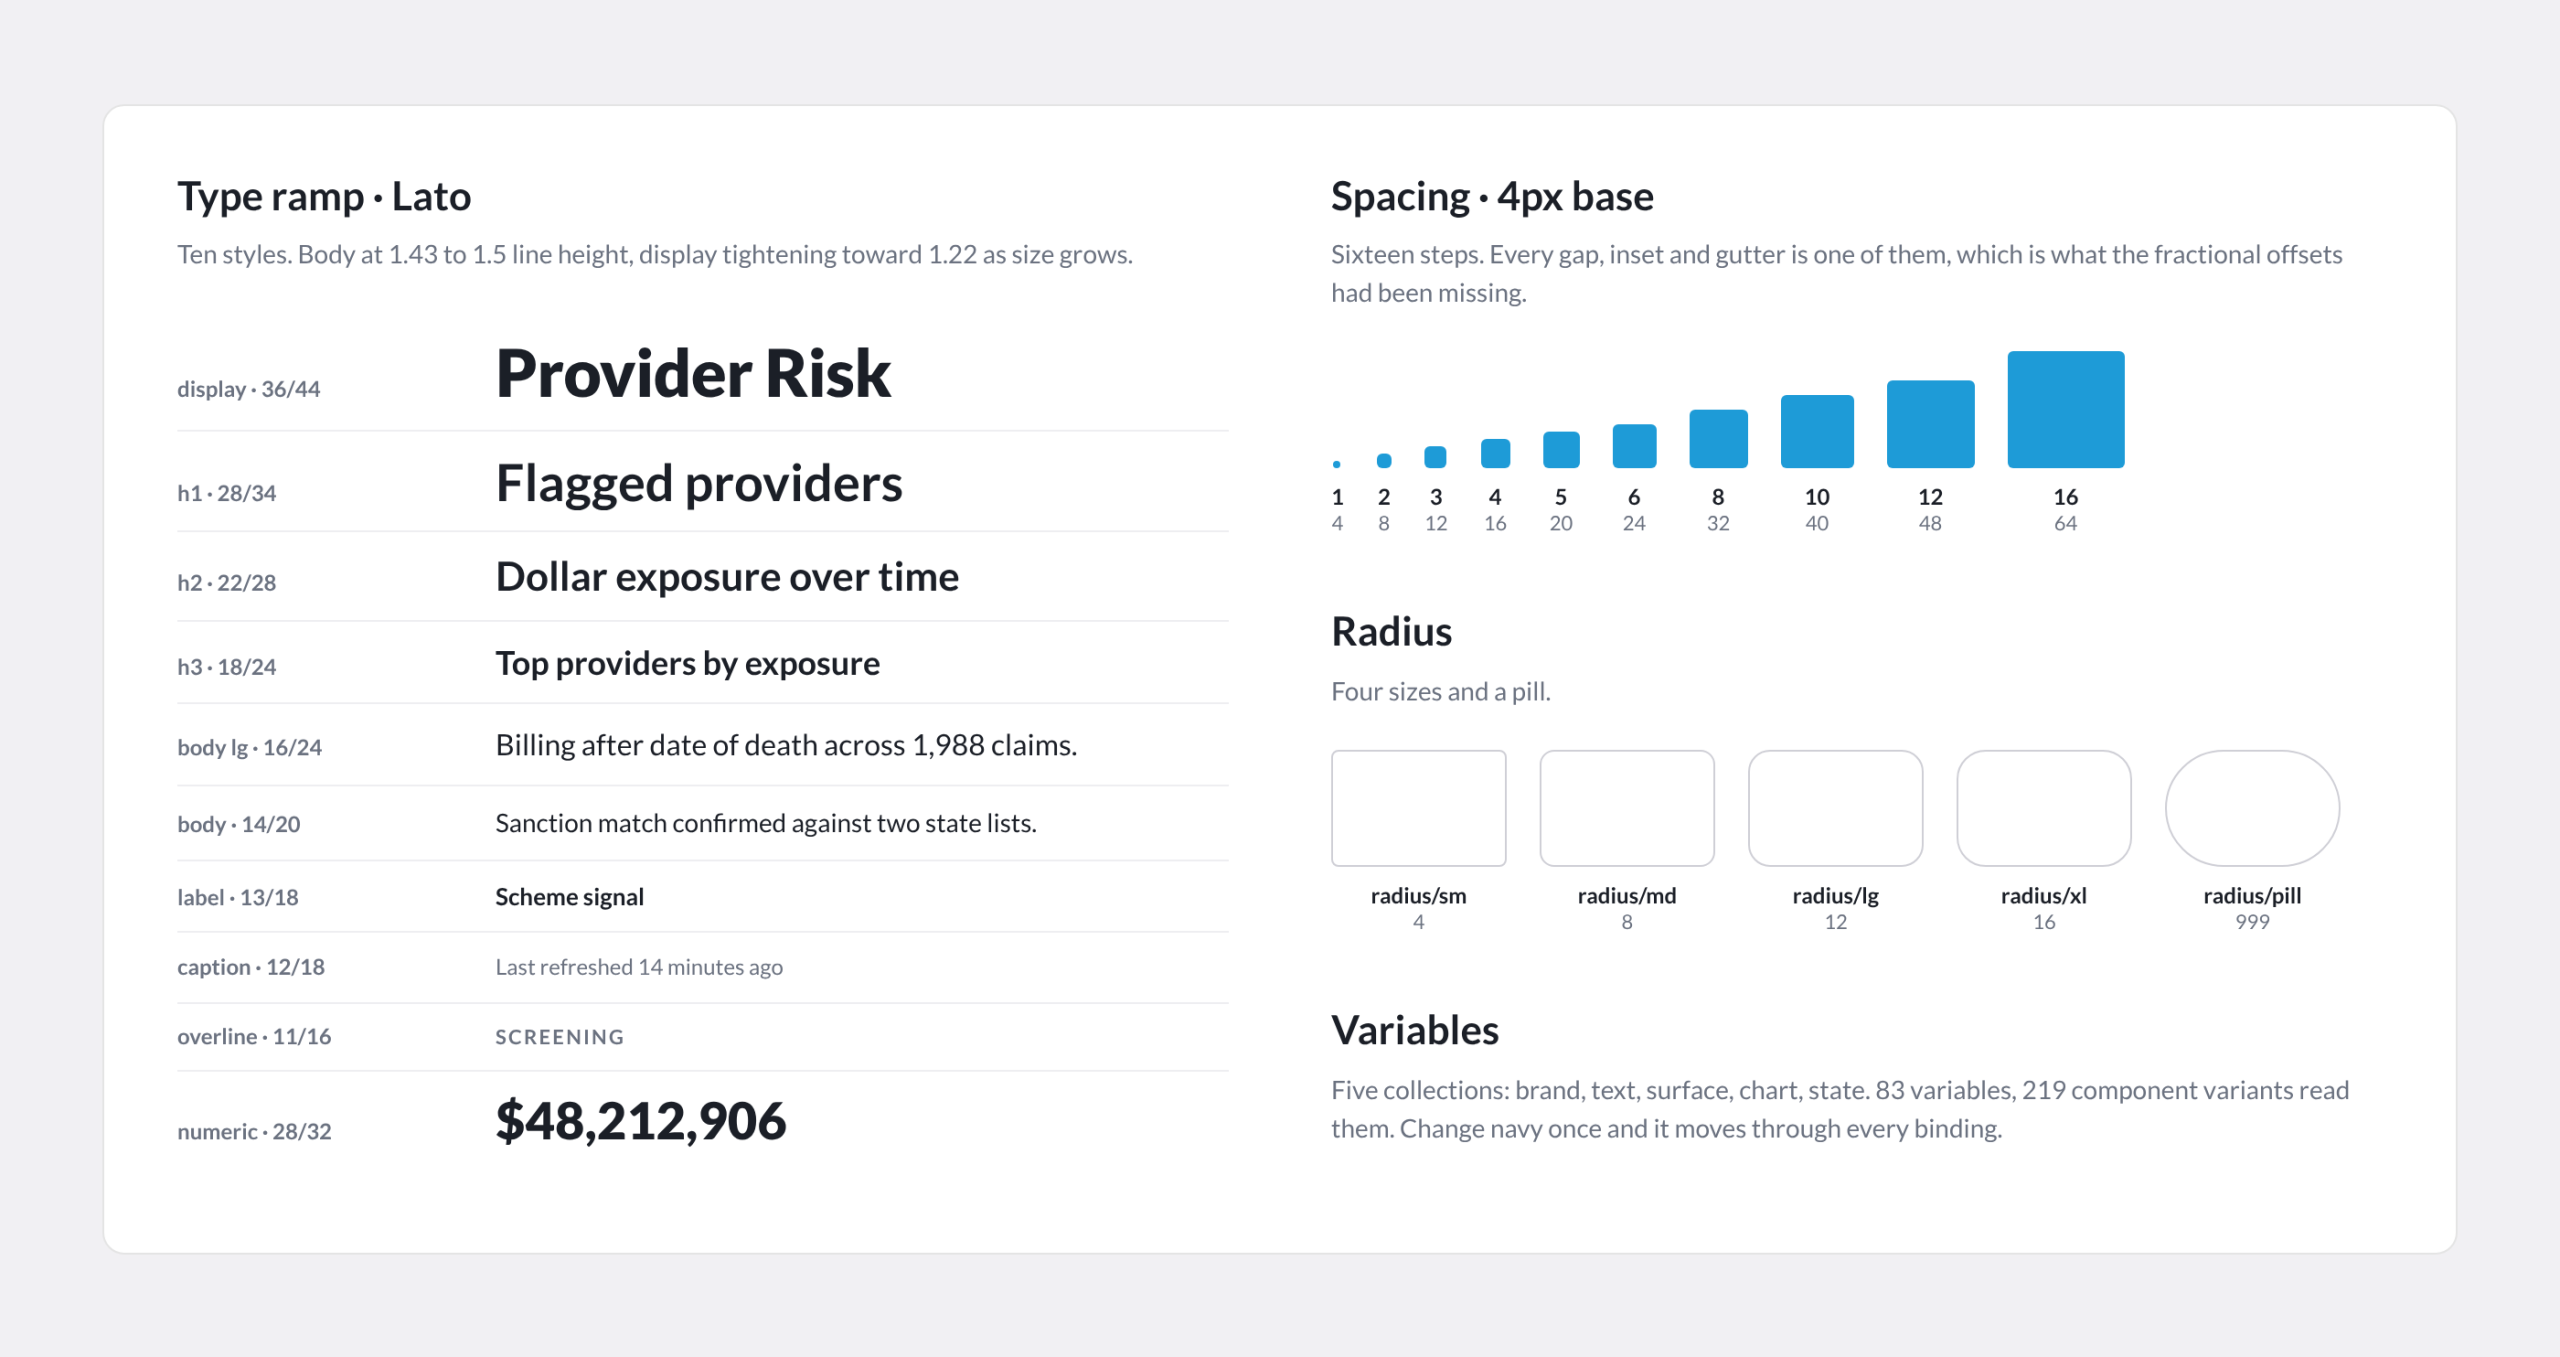
Lato stays. Ten text styles from 12/18 to 36/44, body at 1.43 to 1.5 and display tightening toward 1.22. A 4px spacing scale in sixteen steps, four radii and a pill. None of it is novel; all of it was missing. Every value is a variable, so a developer in Dev Mode reads a token name instead of a hex value, and both engineering teams build from the same source.

The Lato ramp, the 4px scale and the radii. The old system had none of them, which is why nothing lined up.
Status

What shipped and what is next

54 components with 219 variants, 14 text styles and 29 icons, now the build source for every new screen. The library is unpublished on purpose: publishing freezes names, and three component names are still being settled with the engineers who have to type them.

Next, the front end reads the tokens directly, so a palette change becomes a variable change instead of a ticket, and the six-category donut in the overview becomes ranked bars, the finding the audit logged first.

Back